Context
So, you’ve spent the budget and built the telemetry stack. You’re ingesting thousands of metrics a second, and your Grafana dashboards look impressive. But here’s the challenge:
- Is your team getting paged for every minor blip?
- Are they waking up at 3 AM for issues that resolve themselves?
- Does alert fatigue mean critical alerts get lost in the noise?
Some of these challanges can be tacked by adopting Service Level Objectives (SLOs). The journey typically involves navigating the technical complexity of distributed microservices systems and aligning stakeholders. SLOs provide the answer to these alert fatigue problems by helping you distinguish between noise and genuine user impact, ensuring your team only gets paged when it truly matters.
This post addresses both challenges in two parts: Part 1 provides the technical framework (user-focused SLIs, error budgets, burn rate alerting, dependency mapping) that solves alert noise. Part 2 provides the organizational framework (outcome mapping, stakeholder conversations, workshop consensus) that builds alignment. Together, they create a complete path from alert fatigue to SLO-based reliability management.
Signal Sprawl in Microservices Environments
In a modern microservices environment, a single user click sets off a chain reaction. It hits the API Gateway, bounces through authentication, queries three different business services, checks a cache, and maybe fires off an event to a queue. You are monitoring all of this. But which of these signals actually matters?
If you try to alert on everything, you alert on nothing. Infrastructure metrics like database CPU or memory usage tell you about component health, but the question that drives effective alerting is: “Did the user get what they came for?” This shift from infrastructure monitoring to outcome measurement is what makes SLOs powerful.
We’ll explore the specific metrics and measurements to answer this question in the sections below.
The Solution
The key is to organize your SLOs around the promises your system makes, starting from user outcomes and working down through the layers that support them. This creates a hierarchy where each level has clear ownership and purpose:
- User-Facing SLOs: Owned by Product. This is the end-to-end value. “Can I check out my cart?”
- Service-Level SLOs: Owned by Feature Teams. This is the contract for a specific service. “Did the Checkout Service process the request payload?”
- Platform SLOs: Owned by Platform/SRE. This is the foundation. “Is the Kubernetes cluster provisioning pods fast enough to scale for marketing events?”
A note on the Platform layer: If you run a platform team, your “users” are the internal developers. Don’t just monitor CPU health. Monitor their pain points. If a developer waits 10 minutes for a CI pipeline, that’s a violated SLO just as much as a slow website is for end-user.
Step 1: Define User-Facing SLOs (The “What”)
Identify your Critical User Journeys (CUJs). These are the non-negotiables. If the “Change Profile Picture” feature breaks, at worst it’s annoying for users. If “Login” breaks, you might be out of business. That’s why we focus on the business-critical flows.
For each journey, pick a Service Level Indicator (SLI). A Service Level Indicator is the measurable signal that quantifies how well you’re meeting user expectations—the percentage of requests that succeed, respond quickly, or produce correct results. It’s calculated as the ratio of good outcomes to valid attempts. This shifts focus from infrastructure noise (CPU, memory) to actual user impact.
-
Event-based: (Preferred for steady traffic) “99 out of 100 requests succeeded.” This matches how users feel—it works or it doesn’t. However, be aware that during traffic spikes, a brief outage can consume your entire error budget quickly. If you have a 5-minute outage during a flash sale with 10,000 failed requests, event-based SLIs will burn through your budget fast.
-
Time-based: “We were up for 43 minutes this hour.” Better for services with variable traffic patterns, as it weighs each time unit equally regardless of request volume. A 5-minute outage during a traffic spike counts as just 5 bad minutes, not thousands of failed requests. This makes time-based SLIs more forgiving for systems with unpredictable load.
Both SLI types solve the alert noise problem by measuring user outcomes instead of infrastructure metrics. The choice between event-based and time-based depends on your traffic patterns, but both focus on what matters—did the user’s request succeed?
Let’s take an example of a SaaS Project Management Tool. Following the top-down design from earlier (User-Facing → Service → Platform), here’s how this looks for a SaaS project management tool:
| User Workflow | The Promise (SLO) | How we Measure it (Implementation) | Error Budget (30 days) |
| View dashboard | 99.9% of requests < 2s | Monitor the /dashboard route. Count requests faster than 2s vs total. | 43.2 minutes |
| Create tasks | 99.9% Success | Monitor /api/tasks. Count HTTP 200s vs total. | 43.2 minutes |
| Upload files | 99.9% Success within 10s | Monitor /api/upload. Success + Latency < 10s. | 43.2 minutes |
Note: These SLOs use a 30-day rolling window, which is the standard measurement period. The error budget shows how much downtime you can afford while still meeting your target. If you’re building revenue-critical features like payment processing, you can consider higher SLO like 99.95% (21.6 minutes of budget) instead. Sometimes even 99.9% could be unreasonable starting point.
These examples use event-based SLIs since the project management tool has steady traffic patterns. For services with unpredictable traffic spikes, consider time-based SLIs to avoid burning your entire error budget during brief outages.
A word on the cost of nines: To achieve additional nine in terms of availability (99% → 99.9% → 99.99%) typically increases complexity and cost by an order of magnitude. Going from 99.9% to 99.99% could require multi-region deployments, automated failover, comprehensive testing infrastructure, and dedicated on-call rotations. Choose your targets based on actual user needs and business impact, not aspirational goals.
The Improvement Kata Approach
Once you understand the cost of reliability targets, you might be tempted to set aggressive SLOs. This creates a different kind of alert noise. Constant SLO violations that teams learn to ignore, defeating the purpose of distinguishing genuine user impact. Setting ambitious SLO targets that don’t match your current reality leads to constant firefighting and team burnout. If your system currently achieves 98% reliability, setting a 99.99% SLO won’t magically improve it—it will just create alert fatigue and undermine trust in your system.
Instead, use the Improvement Kata pattern to make steady, measurable progress:
- Understand the Direction: Define the outcome you’re working toward. “We want reliability that keeps users happy and reduces on-call burden.”
- Grasp the Reality: Measure your current baseline. If your system is at 99.0% reliability today, that’s your starting point. Document it without judgment, this is data, not failure.
- Set the Next Target: Choose an achievable improvement. If you’re at 99.0%, aim for 99.5% first, not 99.9%. Make your success criteria specific: “Achieve 99.5% for two consecutive weeks with zero false positive alerts.”
- When the target is set, we can use PDCA cycle for implement improvements. This process roughly looks like this:
- Plan: Identify the constraint. “API latency spikes when the database hits 80% CPU during marketing campaigns.”
- Do: Implement one focused fix. “Route read queries to replica instances during peak hours.”
- Check: Measure the impact. “Did P95 latency drop below 500ms during the last campaign?”
- Act: If the improvement worked, standardize it. If not, analyze why and try a different approach.
This incremental approach builds reliability while maintaining team morale and allowing you to learn from each iteration.
Step 2: Mapping the Dependencies
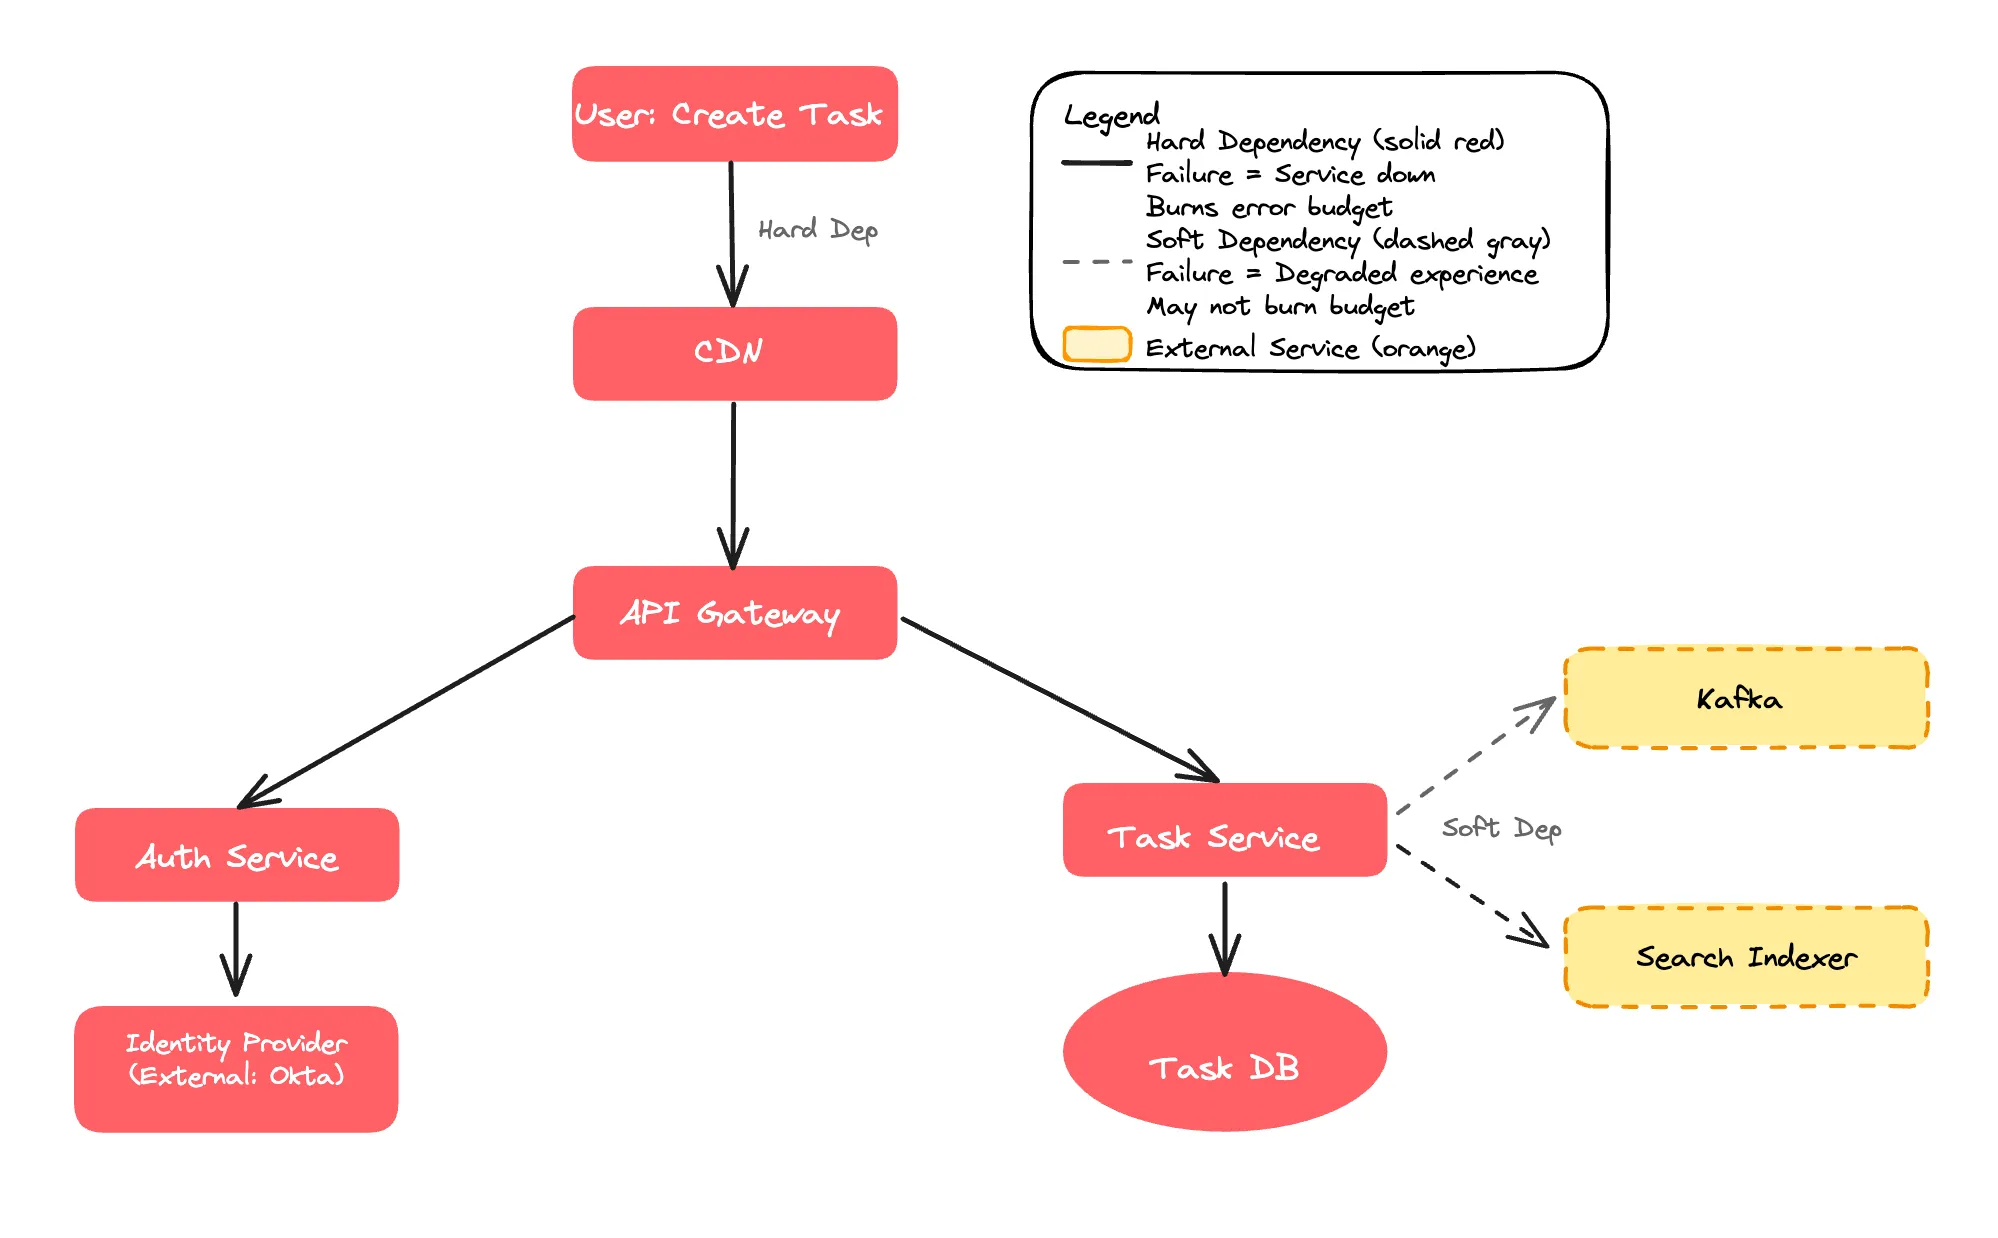
Now that you’ve defined user-facing SLOs, the next step addresses alert noise at the dependency level. Understanding which dependencies are critical prevents false alerts when non-critical services fail. You need to know what breaks what. Visualize the path a request takes. Here, it’s useful to distinguish between Hard Dependencies and Soft Dependencies. For example:
- If the Identity Provider is down, nobody is able to log in. Indentify Provider component is a Hard Dependency.
- If the Search History service fails, the user can still create a task. The experience is degraded, but not broken. Search History is a Soft Dependency:.
Hard dependencies directly consume your error budget when they fail because every failed dependency request results in a failed user request. This is why alerting on hard dependency failures is signal, not noise. Users are actually affected. If your Identity Provider has 99.9% availability and you depend on it, your service can never exceed 99.9% availability without additional resilience patterns. Critical dependencies must be significantly more reliable than your target SLO. We’ll explore the exact math in Step 3.
The most effective reliability improvement is converting hard dependencies into soft ones through graceful degradation. Techniques include:
- Caching
- Circuit breakers
- Async processing
If Search History was initially a hard dependency but you added a fallback to show recent items from cache, you’ve just decoupled your availability from that service and improved your potential reliability significantly.
Note: Implementing graceful degradation patterns like circuit breakers and caching strategies deserves deeper exploration. I’ll try to cover these resilience patterns in detail in a future post.
Step 3: The Math of Error Budgets
If, for example, your User-Facing SLO is 99.9%, your dependencies must be significantly more reliable. For example, if your API Gateway uses your entire 0.1% error budget, and your Database also fails independently 0.1% of the time, your actual availability could be worse than 99.8% due to compounding failures.
With 5 critical hard dependencies and a 99.9% SLO (0.1% error budget). If we try to evenly split the error budget, match might look like:
- 0.1% ÷ 5 = 0.02% per dependency
- Each needs 99.98% reliability (100% - 0.02%)
In practice, some dependencies consume more error budget than others, particularly external integrations outside your control. When you cannot improve a dependency’s reliability, you must implement additional resilience measures (circuit breakers, aggressive timeouts, fallback responses) to prevent that dependency from consuming your entire error budget.
Hard Dependencies require stricter targets—typically one extra nine (99.99% if your target is 99.9%)—to provide buffer for compound failures. This ensures your alerts fire only when user-facing SLOs are truly threatened, maintaining the signal-to-noise ratio we’re trying to achieve. A service cannot exceed the reliability of its critical dependencies. Soft Dependencies allow more flexibility. When the system handles failures gracefully (using the techniques from Step 2), these dependencies can have looser targets without impacting user experience.
Finding the Balance
The goal is to use the budget as an objective tool for decision-making. If your budget is rarely spent (<20%), you might be moving too conservatively or over-investing in infrastructure—consider increasing feature delivery velocity. If the budget is consistently exhausted (>80%), you’re likely moving too fast and should slow down to invest in reliability. The healthy range is 20-80% budget consumption, indicating you’re balancing innovation with reliability.
When Budget is Exhausted
The default response should be a feature freeze, focusing only on P0/P1 issues and reliability work from RCA action items. This signals that reliability debt needs attention before adding new complexity. However, if your budget was consumed by a dependency failure rather than your own code, you can either continue feature development while adding resilience measures (circuit breakers, caching, or fallbacks) to that dependency, or freeze all changes to minimize risk during the instability period.
Regardless of approach, track which dependency burned your budget and negotiate with their team for better reliability.
Step 4: Alerting on Error Budget Consumption Rate
This is where we solve the alert noise problem directly. Instead of alerting on infrastructure thresholds that may or may not affect users, we alert on the rate at which you’re consuming your error budget—a metric that always reflects user impact.
Most teams alert on static thresholds like “CPU > 80%” or “Error Rate > 5%.” This approach has two fundamental problems. First, brief spikes trigger pages even when systems self-heal, creating unnecessary interruptions. Second, low-level error rates (e.g., 0.2%) that never cross the threshold can still consume your entire reliability budget over several days, leaving you blind to slowly degrading systems.
Burn Rate-Based Alerting
Rather than alerting on individual errors, monitor the rate at which you’re consuming your error budget. The burn rate measures how quickly you’re spending your allowed unreliability relative to your measurement window.
A burn rate of 1.0 means you’re consuming budget at the expected pace, your budget will last exactly 30 days. A burn rate of 14 means you’re consuming budget 14 times faster than sustainable—at this rate, you’ll exhaust your budget in around 2 days instead of 30.
This metric allows you to calibrate alerts based on urgency:
Critical alerts fire when the burn rate indicates budget exhaustion within 2 days, requiring immediate response to prevent SLO violation.
Warning alerts fire when budget will be exhausted within 5 days, allowing time for investigation during business hours without emergency escalation.
Example: Burn Rate Alert for Dashboard Latency
For a 99.9% SLO (0.1% error budget over 30 days), a burn rate of 14.4 means you’re consuming budget 14.4x faster than sustainable—exhausting it in approximately 2 days instead of 30 days.
# Critical alert - budget exhausts in 2 days
- alert: DashboardLatencyCriticalBurnRate
  expr: |
    # Calculate current error rate: (total requests - fast requests) / total requests
    (
      sum(rate(http_server_request_duration_seconds_bucket{http_route="/dashboard", le="+Inf"}[1h]))
      -
      sum(rate(http_server_request_duration_seconds_bucket{http_route="/dashboard", le="2.0"}[1h]))
    )
    /
    sum(rate(http_server_request_duration_seconds_bucket{http_route="/dashboard", le="+Inf"}[1h]))
    >
    (0.001 * 14.4)  # Allowed error rate is 0.1% (0.001). Alert if 14.4x higher = 1.44%
  for: 5m
  labels:
    severity: critical
  annotations:
    summary: "Dashboard latency SLO burning 14x too fast - will exhaust in ~2 days"
The formula calculates the percentage of requests that violate the SLO (slower than 2 seconds). When this exceeds 1.44% (14.4 × the allowed 0.1%), you’re on track to exhaust your error budget in 2 days, triggering an immediate page.
The multiplier(14.4 in above example) paired with a 1-hour observation window balances detection speed with noise reduction. A lower burn rate (e.g., 5) would require a longer observation window (6+ hours) to avoid false positives from brief spikes. Higher multipliers (e.g., 30) would only catch catastrophic failures, missing gradual degradations. You can use multiple burn rate thresholds like 14.4 (1-hour window) for critical 2-day alerts, 6 (6-hour window) for warnings at 5 days, and 3 (24-hour window) for slow burns at 10 days.
Part 2: The Art of Stakeholder Alignment
Technical implementation (Part 1) solves the alert noise problem through user-focused metrics and burn rate based alerting. But implementation alone doesn’t achieve adoption. Part 2 addresses the second challenge from the introduction: organizational alignment. Each stakeholder needs to understand how SLOs solve their specific problems.
Each stakeholder evaluates reliability through their own operational lens: VP Engineering cares about team sustainability and reducing the 3AM pages that cause burnout, VP Product focuses on how reliability drives user retention, the CTO evaluates whether current infrastructure can support commitments being made to customers, and VP Sales needs defensible SLAs that won’t create financial exposure from penalty clauses.
The Stakeholder Alignment Process
Getting organizational buy-in for SLO-based alerting requires a structured approach. The goal is to adopt SLO-based alerting as your framework for controlling alert noise and managing feature velocity trade-offs. This requires connecting technical implementation to business outcomes that each stakeholder cares about—a process called outcome mapping.
The process follows three stages:
-
Individual stakeholder conversations: Meet with engineering, product, and CTO separately to understand their specific concerns and map SLO benefits to their operational priorities. These pre-workshop discussions help you understand each stakeholder’s “currency”—the metrics and outcomes they care about.
-
The workshop: Bring all stakeholders together to evaluate SLO targets through business impact scenarios. With context from individual conversations, you can frame the discussion around business outcomes rather than arbitrary reliability percentages.
-
Consensus on adoption: Get agreement on two key decisions: (a) adopting SLO-based alerting to replace traditional threshold-based alerts, and (b) implementing tiered targets that balance reliability, cost, and velocity.
The sections below walk through each stage of this process.
Conversation 1: Engineering Team
Start with engineering leadership to understand their primary pain point: alert fatigue and its impact on team morale. The infrastructure metrics discussed in Step 4 (CPU, memory, disk) create this problem. Your goal is to show how the SLO framework from Part 1—measuring user outcomes instead of infrastructure—directly addresses their concerns.
In the hope that monitoring these signals will catch user-facing issues early, traditional alerting often relies on infrastructure metrics like CPU usage, memory consumption, disk space, load averages, etc. Teams set thresholds like alert when avg CPU exceeds 80% assuming high resource utilization correlates with poor user experience. In practice, this correlation is weak at best. A service might run at 90% CPU while serving requests perfectly, or fail to respond at 30% avg CPU usage. These infrastructure alerts create constant noise with little connection to actual user impact.
When teams receive constant pages for infrastructure metrics that may or may not affect users, engineers become desensitized and begin ignoring alerts. This create risk of critical alerts getting dismissed as a false positive, causing teams to miss genuine incidents that require immediate response. This alert fatigue accelerates burnout.
This is the opposite of the top-down design from Step 1. Instead of starting with user journeys and working down to infrastructure, traditional alerting starts with infrastructure metrics and hopes they correlate to user impact. They rarely do.
SLO-based alerting inverts this approach by monitoring user-facing outcomes directly. Instead of alerting when CPU is high, alert when users are experiencing slow responses that violate your latency SLO. Instead of alerting on memory pressure, alert when error rates indicate users can’t complete their workflows. This transformation reduces alert volume significantly while ensuring each page represents genuine user impact requiring response. Engineers trust these alerts because they know a page means users are affected, not just that some infrastructure metric crossed an arbitrary threshold.
Conversation 2: Product Team
Next, meet with product leadership to understand their concern: maintaining feature velocity while avoiding reactive process overhead after incidents. Your goal is to show how SLOs provide an objective framework for managing the reliability-velocity trade-off.
Product teams typically prioritize growth and feature velocity—their incentive structure rewards shipping capabilities that drive user acquisition and revenue. Reliability often becomes visible only when frequent incidents directly impact users, at which point the reaction is often to add manual safety gates: mandatory PR reviews, manual testing cycles, approval workflows, and deployment freezes during critical periods. While well-intentioned, these reactive measures decrease feature velocity without necessarily improving reliability in measurable ways.
The conversation shifts when you frame SLOs as an explicit trade-off mechanism. Without a defined reliability target, teams oscillate between two extremes: moving fast until a major incident occurs, then adding process overhead that slows development for months afterward. This cycle is expensive—teams lose velocity to process that doesn’t always prevent the next incident.
SLOs create a middle path by setting an agreed-upon reliability threshold. For example, a 99.9% target (~9 hours downtime per year) acknowledges that some downtime is acceptable in exchange for faster feature development. When reliability is within the SLO, product teams can continue shipping quickly without justifying each deployment. When the error budget is consumed, everyone understands that velocity must temporarily slow to address systemic reliability issues.
This approach prevents the reactive pile-on of manual gates. Instead of adding “let’s have two people review every PR” after an incident, teams can ask: “What automated testing or resilience pattern would prevent this failure mode while maintaining our deployment velocity?” The error budget becomes an objective metric for these trade-off decisions, replacing emotional reactions with data-driven choices about how much process overhead is warranted.
Conversation 3: The CTO
Finally, meet with the CTO to understand their multi-dimensional concerns: infrastructure costs, architectural constraints, compliance requirements, and strategic initiatives. Your goal is to demonstrate how SLOs provide data for making informed trade-off decisions across these competing priorities.
CTOs balance competing priorities like infrastructure costs, compliance, architectural modernization, business continuity (RTO/RPO), and enabling strategic capabilities like AI/ML platforms. They evaluate decisions across quarters and years, weighing immediate constraints against long-term flexibility.
SLO-based alerting provides quantifiable data for architectural decisions. Instead of debating infrastructure upgrades based on intuition, SLOs reveal gaps between current capabilities and requirements. If your currents backup strategy yields 4-hour RTO but you want 99.95% uptime (22 minutes monthly downtime), the SLO framework makes this constraint measurable, shifting conversations from “should we invest?” to “which approach closes this gap most cost-effectively?”
SLOs create objective criteria for strategic trade-offs. Error budget data shows whether reliability is constraining the business or if the organization can prioritize strategic initiatives. This extends to data platform readiness—SLOs on data freshness, pipeline reliability, and data quality reveal whether your infrastructure can support AI features product is requesting. If data pipelines show 90% on-time delivery with quality issues, you’re not ready to promise real-time ML recommendations regardless of model sophistication.
Finally, SLOs provide compliance documentation and guide architectural modernization. Many regulatory frameworks require demonstrable uptime targets and incident response protocols—SLO-based alerting creates this measurement infrastructure while providing evidence of reliability performance over time. For CTOs evaluating cloud migration or platform evolution, SLO data shows which reliability patterns must be preserved (databases at 99.98%) versus which can evolve (background jobs at 99.5%), helping prioritize investments appropriately.
The Alignment Meeting
Now that you understand each stakeholder’s concerns and outcomes, bring everyone together for the alignment. The goal is twofold:
- Get consensus on adopting SLO-based alerting to replace traditional threshold-based alerts
- Agree on tiered SLO targets that balance reliability, cost, and feature velocity.
Use the insights from your individual conversations to frame the discussion around business outcomes. Engineering wants to reduce alert fatigue, Product wants predictable velocity management, and the CTO needs data for architectural decisions. The scenario analysis below shows how different SLO targets impact all three concerns simultaneously.
Scenario Analysis
Let’s consider the scenario where the correlation of reliability target, infrastructure costs, customer churn and feature velocity is as follows:
| Scenario | Reliability Target | Infrastructure Cost | Customer Impact (Churn) | Feature Velocity |
| A: Status Quo | 99.73% | Low (Base) | High ($240k risk) | High |
| B: Modest | 99.9% | Moderate (+$25k/mo) | Low ($60k risk) | Medium |
| C: Aggressive | 99.95% | High (+$100k/mo) | Minimal | Low |
Scenario A (Status Quo) maintains current reliability without additional investment. This allows maximum feature velocity since teams aren’t constrained by reliability work. However, the frequent outages create customer churn risk. For a B2B SaaS business with 1000 customers at $20k annual contract value, losing just 12 customers due to reliability issues represents $240k in annual recurring revenue at risk.
Scenario B (Slight Improvement) targets 99.9% reliability through automated failover and read replicas. The monthly infrastructure cost increases by $25k, and feature velocity decreases roughly 20-30% as teams invest in automated testing, staged rollouts, and error budget monitoring. Customer churn risk drops significantly—most users tolerate 9 hours of downtime annually when incidents are handled transparently. This scenario reduces the churn risk to approximately $60k while maintaining reasonable development pace.
Scenario C (Aggressive Improvement) pursues 99.95% reliability through multi-region active-active deployments, extensive testing infrastructure, and strict change management. Infrastructure costs jump to $100k+ monthly, and feature velocity can drop 50% or more as most engineering effort shifts to reliability work. While customer churn risk becomes minimal, the opportunity cost is substantial—delayed features may cost more in lost revenue than the reliability issues prevented.
Scenario B typically provides the optimal balance for most organizations. It reduces customer churn risk by 75% while requiring modest infrastructure investment and maintaining reasonable feature velocity that keeps the product competitive.
The dependency mapping from Step 2 focused on architectural relationships, what your service depends on. Tiered SLO targets address a different question of “how critical is each service to your business?” These frameworks complement each other. A service with many hard dependencies often indicates high business criticality, while services that are soft dependencies for others can typically accept lower targets.
Implement Tiered SLO Targets
Different services require different reliability levels. Implement a tiered approach to optimize infrastructure costs while protecting critical user journeys.
-
Tier 1 (Critical): This includes flows like Payment processing and authentication. These services directly impact revenue or security. Target can be on higher side here(say 99.95%). Page on-call immediately when error budget consumption indicates 2-day exhaustion. Failures here cause immediate user-facing impact and potential business losses.
-
Tier 2 (Core Application): Task creation, dashboard access. These services enable primary user workflows. Target 99.9% (43.2 minutes downtime per month). Page on-call when burn rate indicates 5-day exhaustion. Failures degrade user experience but users can typically wait for resolution.
-
Tier 3 (Background Services): Reporting, analytics processing. These services support secondary functionality. Target 99.5% (3.6 hours downtime per month). Create tickets for investigation during business hours. Failures are noticeable but don’t block critical user actions.
This outcome achieves both goals from the introduction: it solves alert fatigue by ensuring teams only get paged for genuine user impact, and it builds organizational alignment by giving each stakeholder an objective framework for their concerns. Engineering gets relief from noise, Product gets predictable velocity management, and the CTO gets data for strategic decisions.
Conclusion
Most organizations have telemetry infrastructure but struggle with alert noise. SLO-based alerting solves this by measuring what matters—whether users can complete their critical journeys.
Start with one critical user journey. Define success from the user’s perspective, measure it, and set a realistic target. Alert on burn rate instead of infrastructure thresholds. This single journey becomes your template for expanding SLO coverage.
Eventually, teams get paged only when users are genuinely affected, eliminating noise while maintaining reliability.